"use client";

import BeeswarmChart, {
  type BeeswarmChartPoint,
} from "@/components/ui/beeswarm-chart";
import { useState } from "react";

function noise(index: number, salt: number) {
  const value = Math.sin(index * 12.9898 + salt * 78.233) * 43758.5453;
  return value - Math.floor(value);
}

const PLANS = ["Starter", "Growth", "Scale", "Enterprise"];
const COMPANIES = [
  "Acme",
  "Northwind",
  "Fernlake",
  "Harborview",
  "Crestline",
  "Alderton",
  "Rivermark",
  "Lumen",
  "Bellwood",
  "Oakfield",
];

const DEALS: BeeswarmChartPoint[] = PLANS.flatMap((plan, planIndex) =>
  Array.from({ length: [26, 24, 18, 12][planIndex] }, (_, index) => {
    const base = [4, 11, 24, 50][planIndex];
    const spread = [4, 7, 12, 26][planIndex];
    const value =
      Math.round(
        (base +
          (noise(index, planIndex + 1) + noise(index, planIndex + 9) - 1) *
            spread) *
          10,
      ) / 10;
    return {
      id: `${plan}-${index}`,
      group: plan,
      value: Math.max(0.6, value),
      label: `${COMPANIES[(index + planIndex * 3) % COMPANIES.length]} ${plan === "Enterprise" ? "Group" : "Labs"} ${index + 1}`,
    };
  }),
);

function BeeswarmChartDemo() {
  const [selected, setSelected] = useState<string | null>("Growth-4");
  const deal = DEALS.find((point) => point.id === selected);

  return (
    <div className="flex w-full max-w-2xl flex-col gap-3 rounded-2xl border border-line bg-surface p-5">
      <h3 className="text-[15px] font-extrabold text-ink">
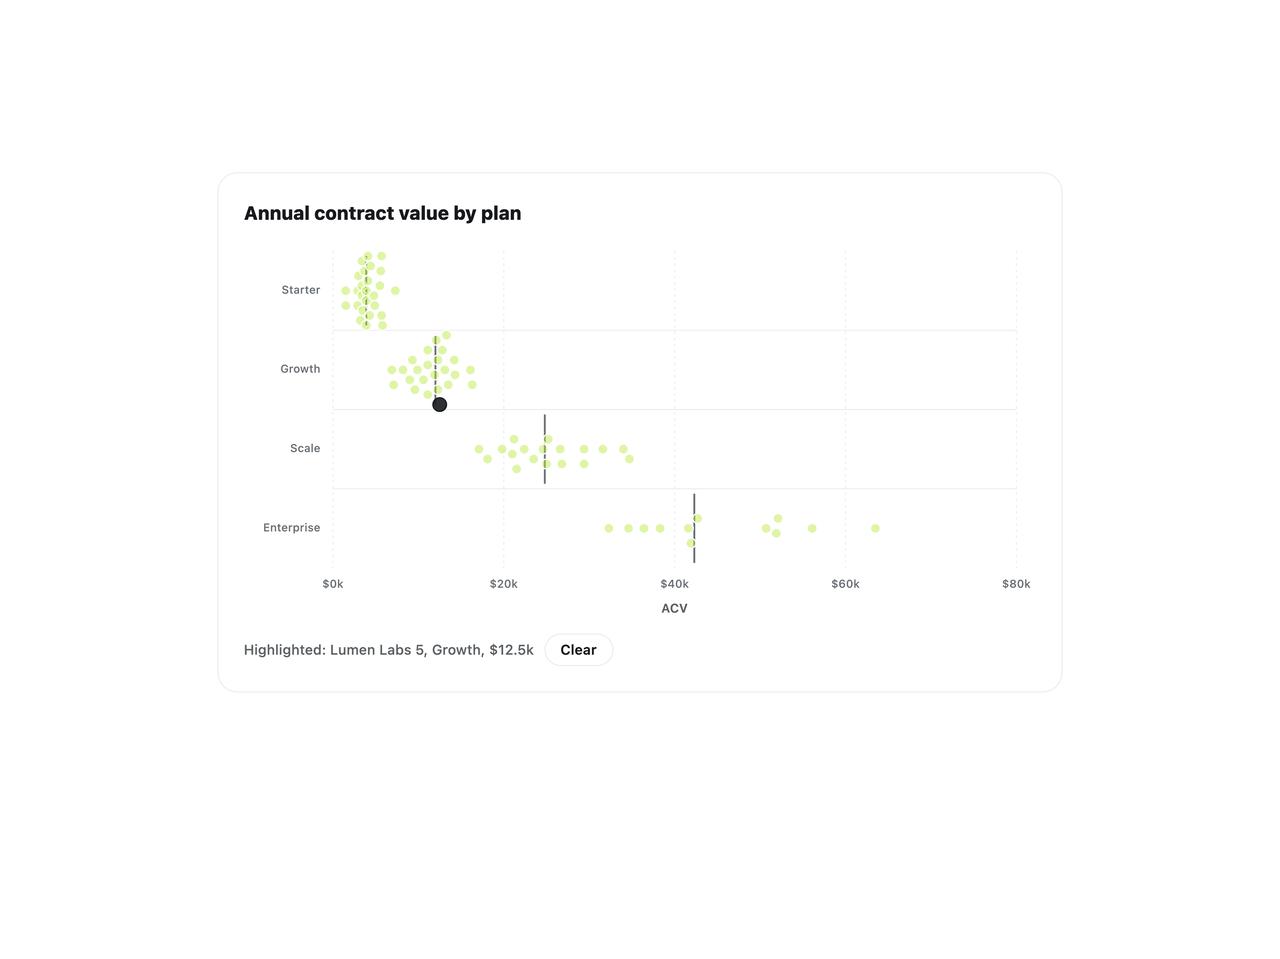
        Annual contract value by plan
      </h3>
      <BeeswarmChart
        points={DEALS}
        groups={PLANS}
        selected={selected}
        onSelect={setSelected}
        valueLabel="ACV"
        format={(value) => `$${value}k`}
        label="Annual contract value of 80 accounts, grouped by plan"
      />
      <div className="flex flex-wrap items-center gap-2">
        <p className="text-[11px] font-medium text-ink-soft" aria-live="polite">
          {deal
            ? `Highlighted: ${deal.label}, ${deal.group}, $${deal.value}k`
            : "Nothing highlighted"}
        </p>
        {deal && (
          <button
            type="button"
            className="rounded-full border border-line px-3 py-1 text-[11px] font-semibold text-ink"
            onClick={() => setSelected(null)}
          >
            Clear
          </button>
        )}
      </div>
    </div>
  );
}

export default BeeswarmChartDemo;