"use client";

import KaplanMeierChart from "@/components/ui/kaplan-meier-chart";
import type { KaplanMeierChartGroup } from "@/components/ui/kaplan-meier-chart";

/** Seeded, so every render and every visitor sees the same data. */
function rng(seed: number) {
  let a = seed >>> 0;
  return () => {
    a = (a + 0x6d2b79f5) >>> 0;
    let t = a;
    t = Math.imul(t ^ (t >>> 15), t | 1);
    t ^= t + Math.imul(t ^ (t >>> 7), t | 61);
    return ((t ^ (t >>> 14)) >>> 0) / 4294967296;
  };
}

function cohort(
  seed: number,
  size: number,
  scale: number,
  shape: number,
): KaplanMeierChartGroup["subjects"] {
  const random = rng(seed);
  return Array.from({ length: size }, () => {
    const churn = scale * (-Math.log(Math.max(1e-9, random()))) ** (1 / shape);
    const observed = 2 + random() * 22;
    return churn <= observed
      ? { time: Math.max(0.2, Math.round(churn * 10) / 10), event: true }
      : { time: Math.round(observed * 10) / 10, event: false };
  });
}

const cohorts: KaplanMeierChartGroup[] = [
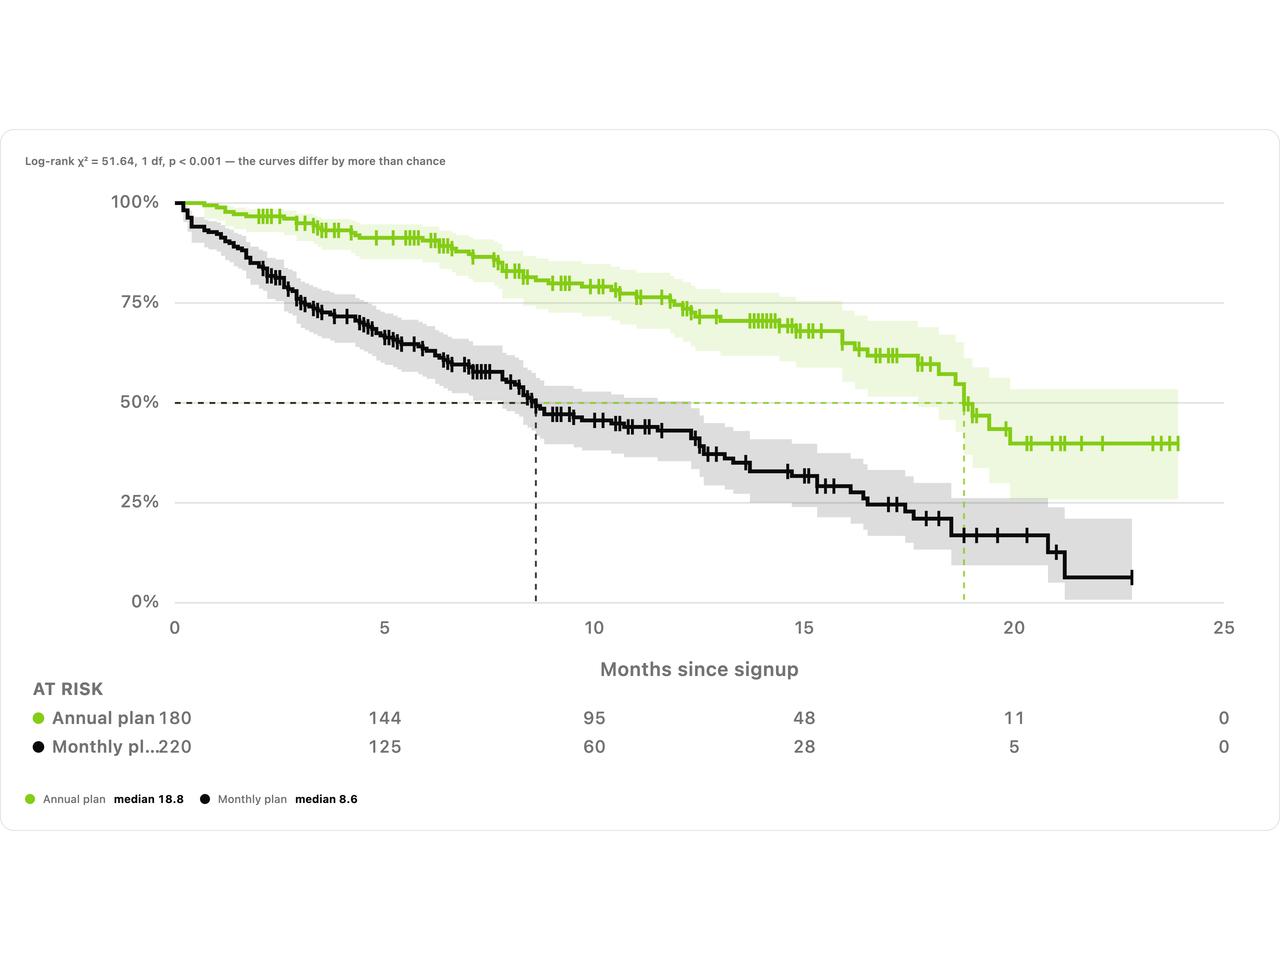
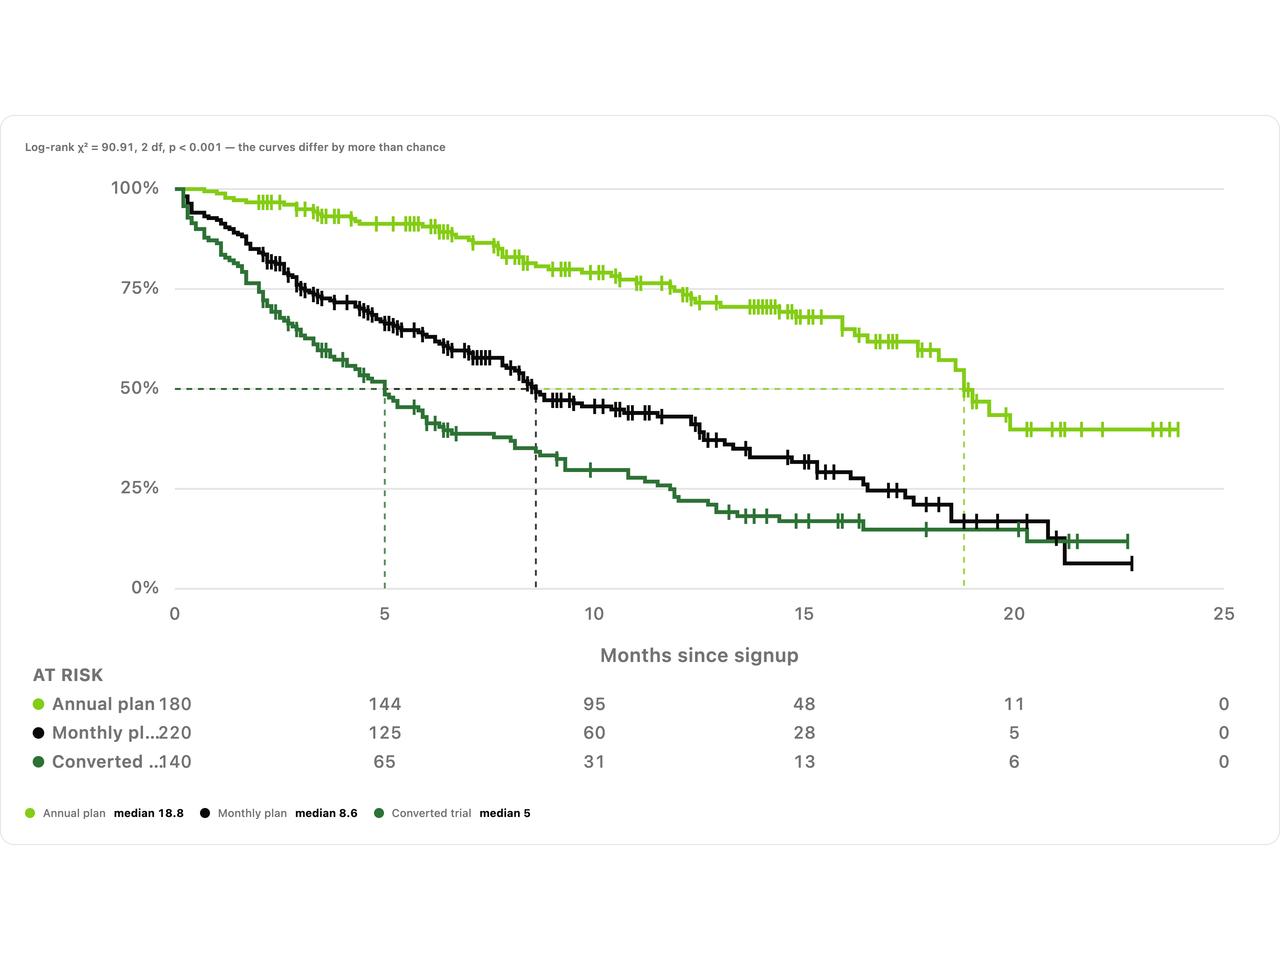
  { id: "annual", label: "Annual plan", subjects: cohort(3, 180, 34, 1.3) },
  { id: "monthly", label: "Monthly plan", subjects: cohort(5, 220, 13, 0.9) },
];

export default function KaplanMeierChartDemo() {
  return (
    <div className="w-full rounded-xl border bg-card p-6 text-foreground">
      <KaplanMeierChart
        groups={cohorts}
        showConfidence
        timeLabel="Months since signup"
        formatTime={(value) => String(Math.round(value * 10) / 10)}
        label="Share of customers still subscribed by months since signup, by plan"
      />
    </div>
  );
}