"use client";

import {
  SunburstChart,
  type SunburstChartNode,
} from "@/components/ui/sunburst-chart";

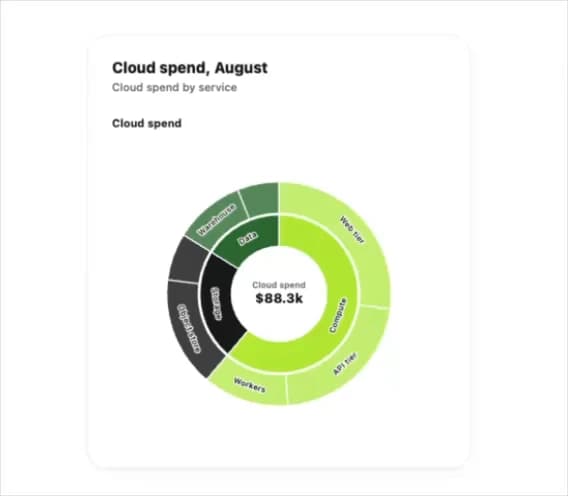
const data: SunburstChartNode = {
  id: "root",
  label: "Cloud spend",
  children: [
    {
      id: "compute",
      label: "Compute",
      children: [
        { id: "web-tier", label: "Web tier", value: 24 },
        { id: "api-tier", label: "API tier", value: 19 },
        { id: "workers", label: "Workers", value: 11 },
      ],
    },
    {
      id: "storage",
      label: "Storage",
      children: [
        { id: "object-store", label: "Object store", value: 14 },
        { id: "backups", label: "Backups", value: 6 },
      ],
    },
    {
      id: "data",
      label: "Data",
      children: [
        { id: "warehouse", label: "Warehouse", value: 9 },
        { id: "streaming", label: "Streaming", value: 5.3 },
      ],
    },
  ],
};

export default function SunburstChartDemo() {
  return (
    <div className="flex w-full items-center justify-center bg-background p-10">
      <div className="flex w-full max-w-sm flex-col gap-1 rounded-[var(--radius-card)] border border-line bg-surface p-6 shadow-[var(--shadow-card)]">
        <p className="text-[15px] font-extrabold leading-none text-ink">
          Cloud spend, August
        </p>
        <p className="text-[11px] font-medium text-ink-faint">
          Cloud spend by service
        </p>
        <div className="mt-4 flex items-center justify-center">
          <SunburstChart
            data={data}
            label="Cloud spend by service"
            valueLabel="Spend"
            format={(value) => `$${value.toFixed(1)}k`}
            size={300}
          />
        </div>
      </div>
    </div>
  );
}