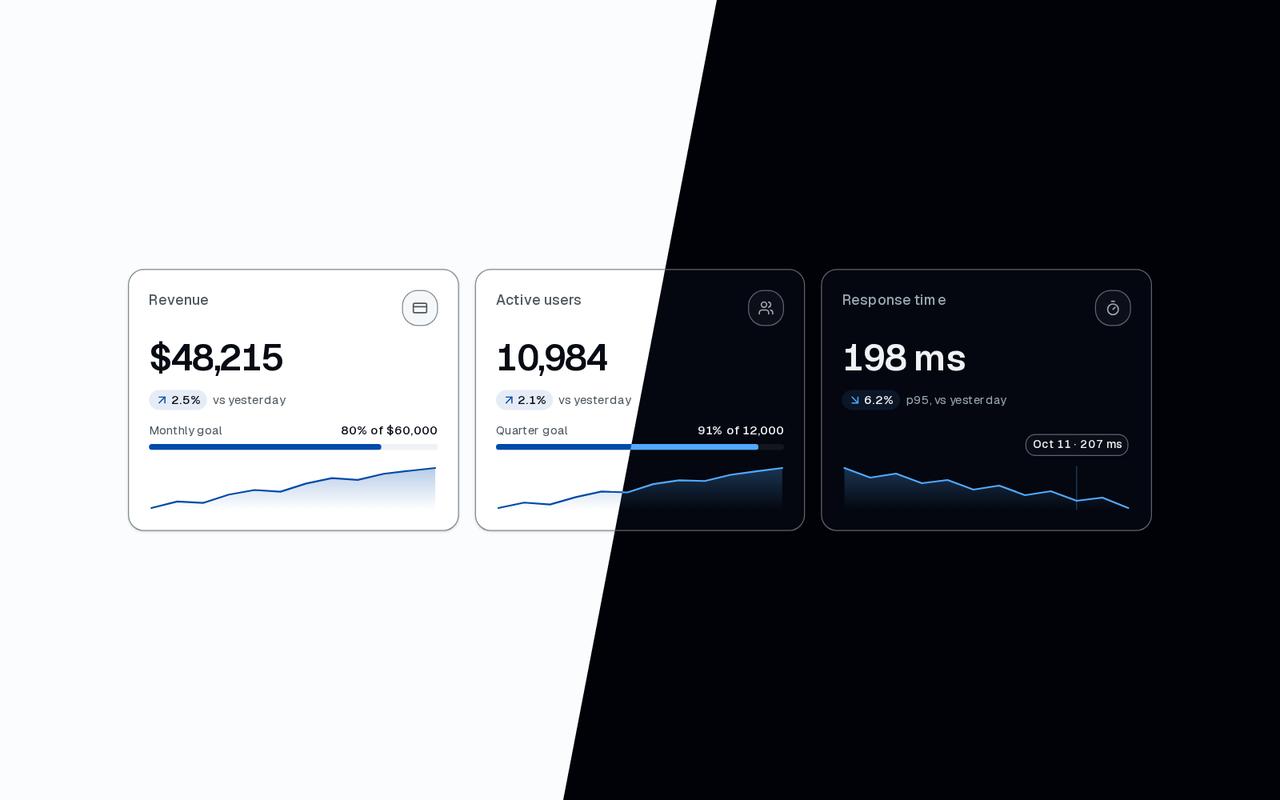
"use client";

import { CreditCard, Timer, Users } from "lucide-react";
import { useEffect, useState } from "react";
import { StatCard } from "@/components/ui/stat-card";

const settings = {
  /** New numbers every couple of seconds. */
  live: true,
  loading: false,
  showGoal: true,
  showTrend: true,
};

/** The last 12 days up to the newest point, as "Oct 13". */
const DAY_NAME = new Intl.DateTimeFormat("en-US", {
  day: "numeric",
  month: "short",
  timeZone: "UTC",
});
const FIRST_DAY = Date.UTC(2026, 9, 2);
const DAY_MS = 86_400_000;
const POINTS = 12;
const daysEnding = (offset: number) =>
  Array.from({ length: POINTS }, (_, index) =>
    DAY_NAME.format(new Date(FIRST_DAY + (offset + index) * DAY_MS))
  );

const START = {
  day: 0,
  latency: [248, 236, 241, 229, 233, 221, 226, 214, 219, 207, 211, 198],
  revenue: [
    31_240, 33_980, 33_410, 36_920, 38_870, 38_150, 41_630, 43_920, 43_180,
    45_760, 47_020, 48_215,
  ],
  users: [
    8240, 8610, 8480, 8990, 9370, 9310, 9880, 10_140, 10_090, 10_520, 10_760,
    10_984,
  ],
};

const WHOLE = new Intl.NumberFormat("en-US", { maximumFractionDigits: 0 });
const asDollars = (value: number) => `$${WHOLE.format(value)}`;
const asCount = (value: number) => WHOLE.format(value);
const asMilliseconds = (value: number) => `${Math.round(value)} ms`;

/** Change of the last value against the one before, in percent. */
const change = (values: readonly number[]) => {
  const last = values.at(-1) ?? 0;
  const previous = values.at(-2) ?? last;
  return previous === 0 ? 0 : ((last - previous) / previous) * 100;
};

/** A repeatable wobble (the same story on every visit): a sine of the day and a phase. */
const wobble = (day: number, phase: number) =>
  Math.sin(day * 1.7 + phase) * 0.6 + Math.sin(day * 0.6 + phase * 2) * 0.4;

/** The window moves on a day: the oldest value goes, a new one comes with a small step. */
const next = (values: readonly number[], growth: number, spread: number) => {
  const last = values.at(-1) ?? 0;
  return [...values.slice(1), Math.round(last * (1 + growth + spread))];
};

const TICK_MS = 1800;

/** Three live KPIs: revenue towards its goal, active users, and a latency where lower is better. */
export default function Demo(props: Partial<typeof settings>) {
  const { live, loading, showGoal, showTrend } = { ...settings, ...props };
  const [series, setSeries] = useState(START);

  useEffect(() => {
    if (!live) {
      return;
    }
    const timer = window.setInterval(() => {
      setSeries((current) => {
        const day = current.day + 1;
        return {
          day,
          latency: next(current.latency, -0.004, wobble(day, 2) * 0.045),
          revenue: next(current.revenue, 0.012, wobble(day, 0) * 0.04),
          users: next(current.users, 0.008, wobble(day, 1) * 0.025),
        };
      });
    }, TICK_MS);
    return () => window.clearInterval(timer);
  }, [live]);

  const last = (values: readonly number[]) => values.at(-1) ?? 0;
  const status = loading ? ("loading" as const) : ("ready" as const);
  const trend = (values: readonly number[]) => (showTrend ? values : undefined);
  const days = daysEnding(series.day);

  return (
    <div className="flex min-h-[480px] w-full items-center justify-center bg-background p-4 sm:p-8">
      <div className="grid w-full max-w-5xl gap-4 sm:grid-cols-2 lg:grid-cols-3">
        <StatCard
          delta={change(series.revenue)}
          deltaLabel="vs yesterday"
          formatValue={asDollars}
          icon={<CreditCard />}
          label="Revenue"
          live={live}
          status={status}
          target={
            showGoal ? { label: "Monthly goal", value: 60_000 } : undefined
          }
          trend={trend(series.revenue)}
          trendLabels={days}
          value={last(series.revenue)}
        />
        <StatCard
          delta={change(series.users)}
          deltaLabel="vs yesterday"
          formatValue={asCount}
          icon={<Users />}
          label="Active users"
          live={live}
          status={status}
          target={
            showGoal ? { label: "Quarter goal", value: 12_000 } : undefined
          }
          trend={trend(series.users)}
          trendLabels={days}
          value={last(series.users)}
        />
        <StatCard
          delta={change(series.latency)}
          deltaLabel="p95, vs yesterday"
          formatValue={asMilliseconds}
          icon={<Timer />}
          label="Response time"
          live={live}
          lowerIsBetter
          status={status}
          trend={trend(series.latency)}
          trendLabels={days}
          value={last(series.latency)}
        />
      </div>
    </div>
  );
}